01 / The question
How might Ghana’s TB burden change by 2030?
The historical series is short—34 annual observations—so a more complex model is not automatically a better model.
The analysis uses IHME Global Burden of Disease 2023 estimates to describe long-run changes and test whether neural or hybrid models improve six-year holdout prediction over transparent time-series baselines.
Train on 1990–2017, evaluate on 2018–2023, select a model separately for each endpoint, refit on the complete series, and forecast 2024–2030.
02 / Methodology
Eight models, one honest holdout period.
Prepare endpoints
Build annual age-standardized incidence, mortality, and mortality-to-incidence ratio series.
Diagnose trends
Use ADF/KPSS tests, ACF/PACF plots, rolling statistics, and endpoint-specific differencing.
Fit candidates
Compare Naive, Drift, ARIMA, ETS, LSTM, Causal TCN, ARIMA–LSTM, and multistep LSTM.
Evaluate
Rank 2018–2023 predictions using MAE, RMSE, and MAPE, without training on the test period.
Propagate uncertainty
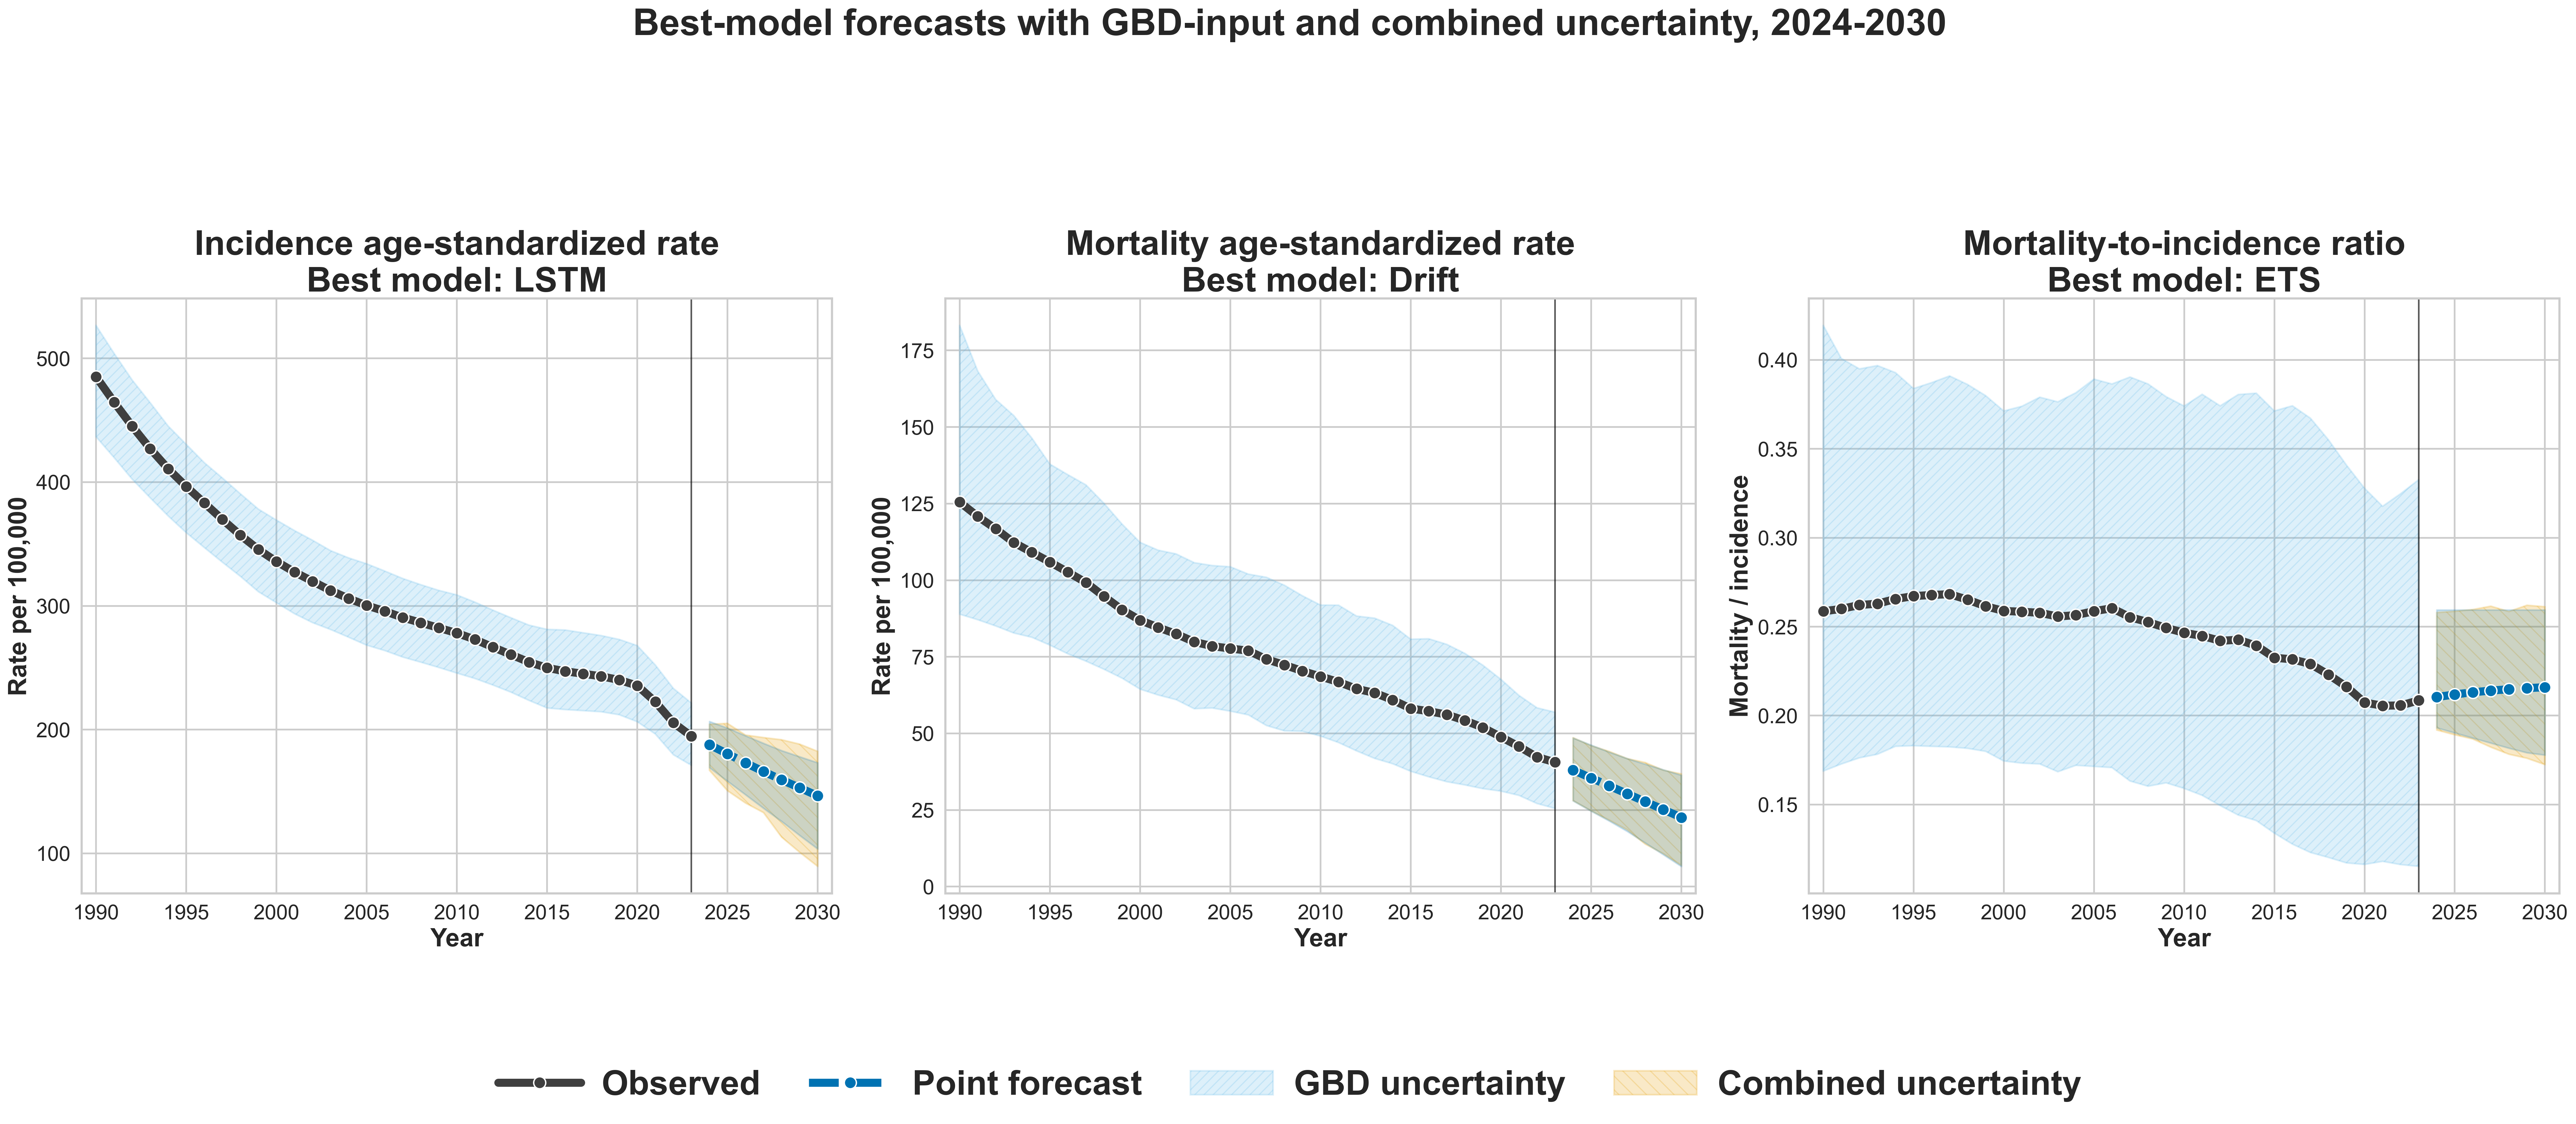
Simulate historical GBD trajectories and combine input uncertainty with empirical holdout residuals.
03 / Findings
Incidence and mortality fell sharply—but different models won.
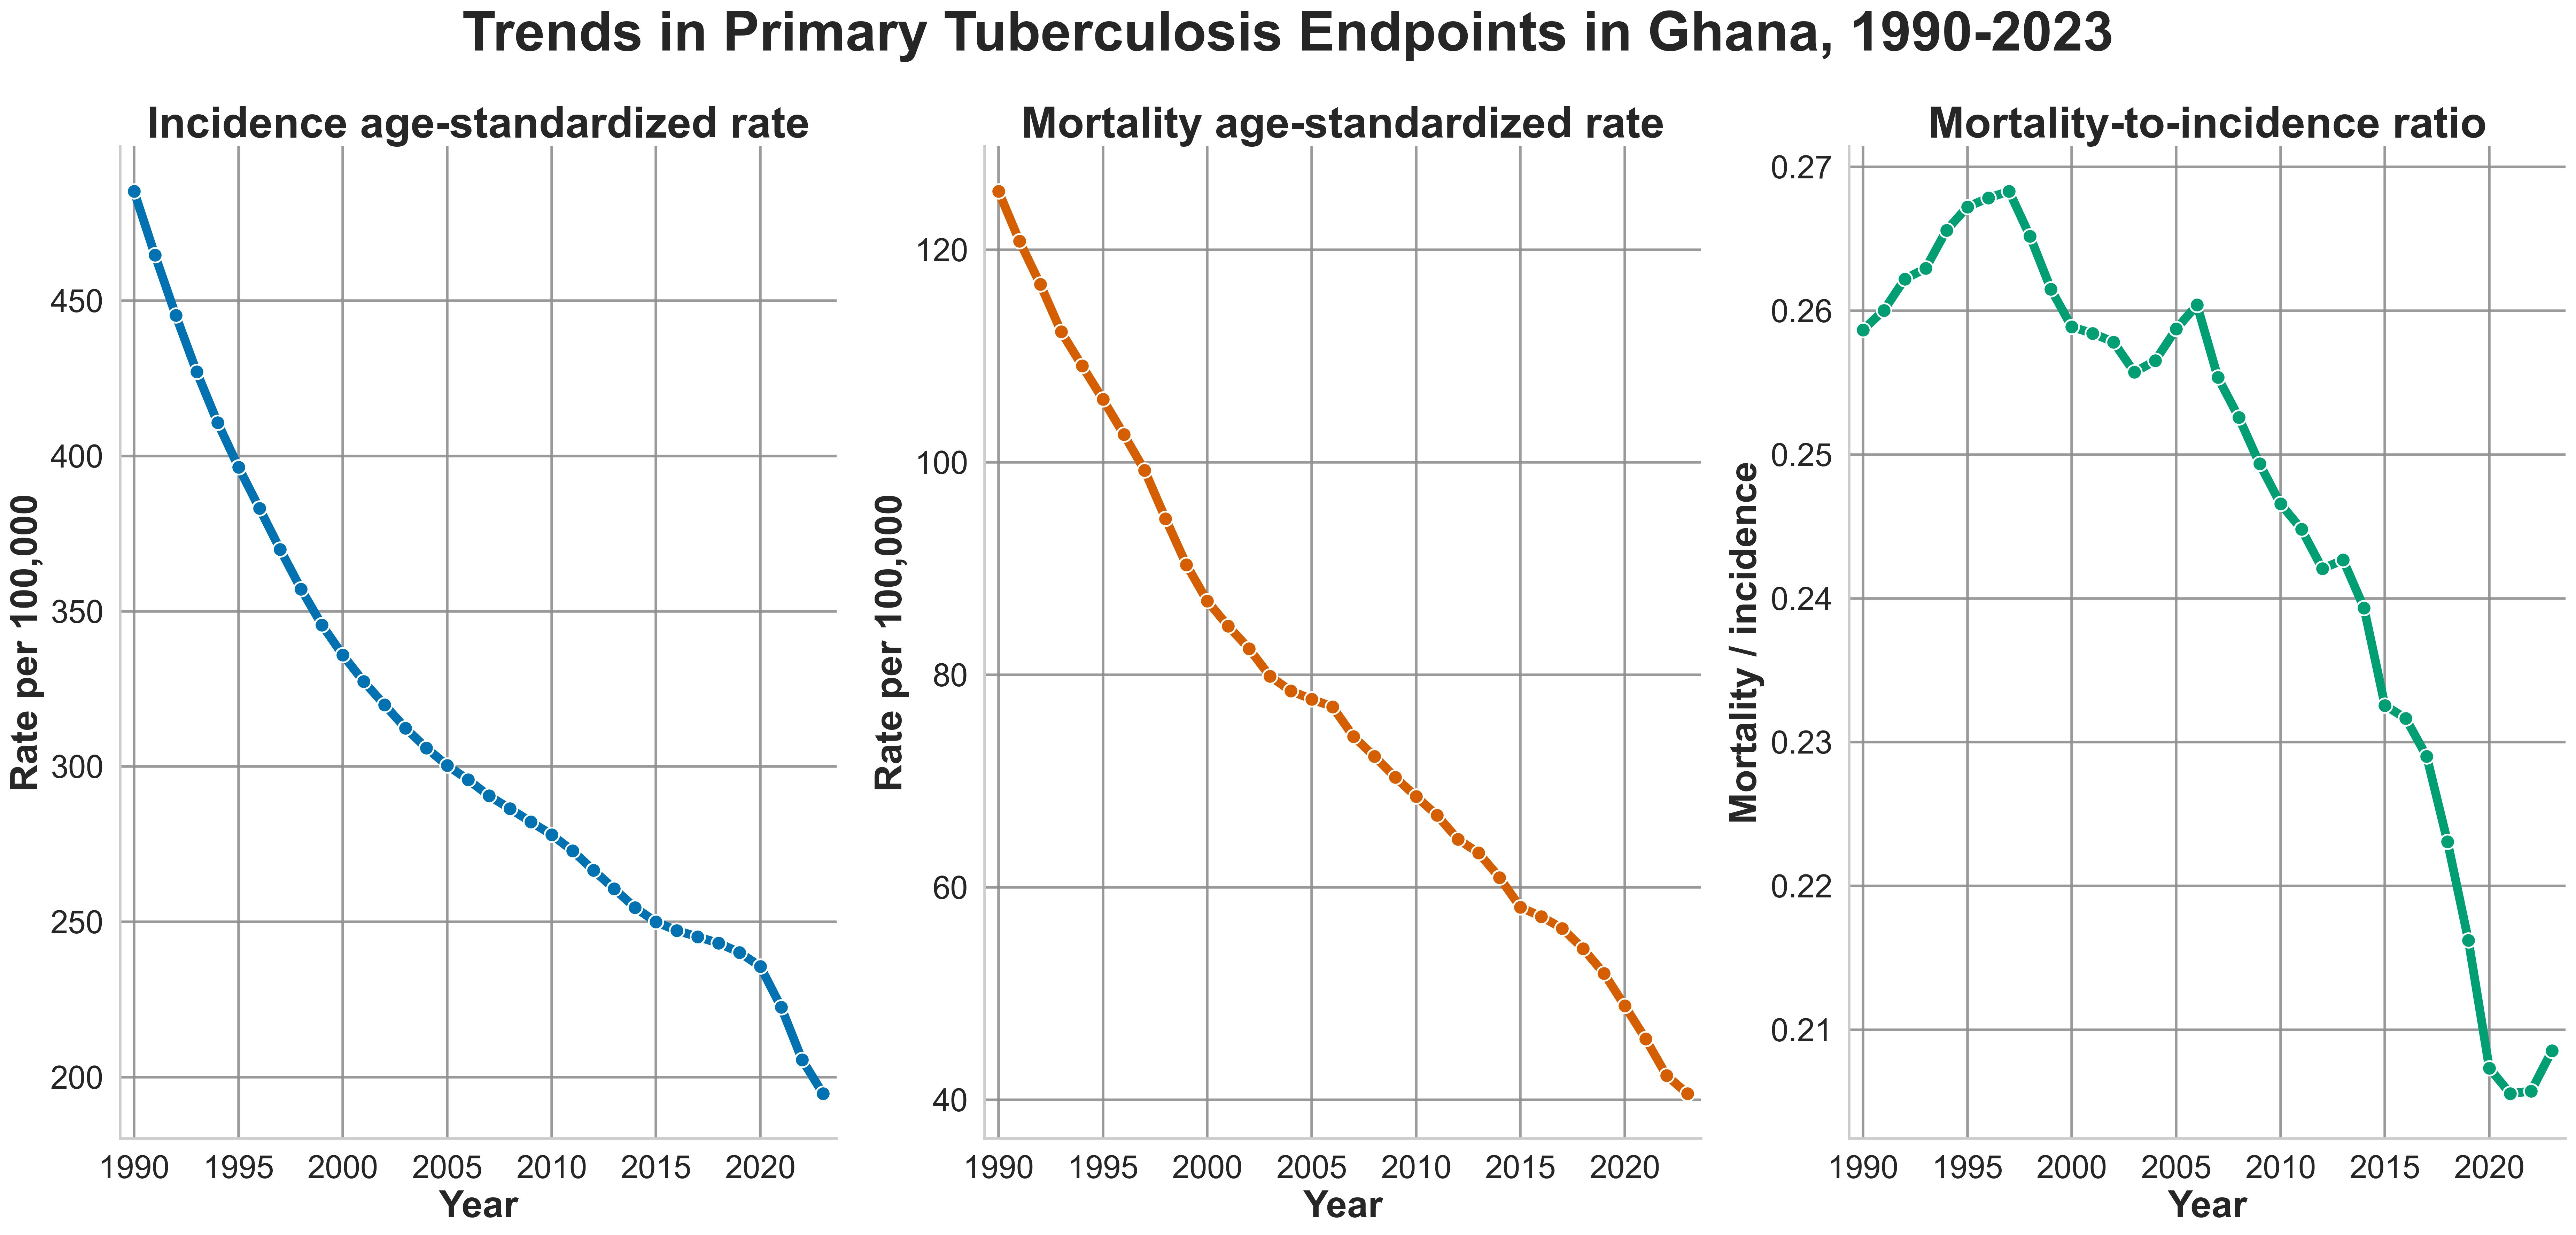
485.2 to 194.7 per 100,000
125.5 to 40.6 per 100,000
LSTM point forecast per 100,000
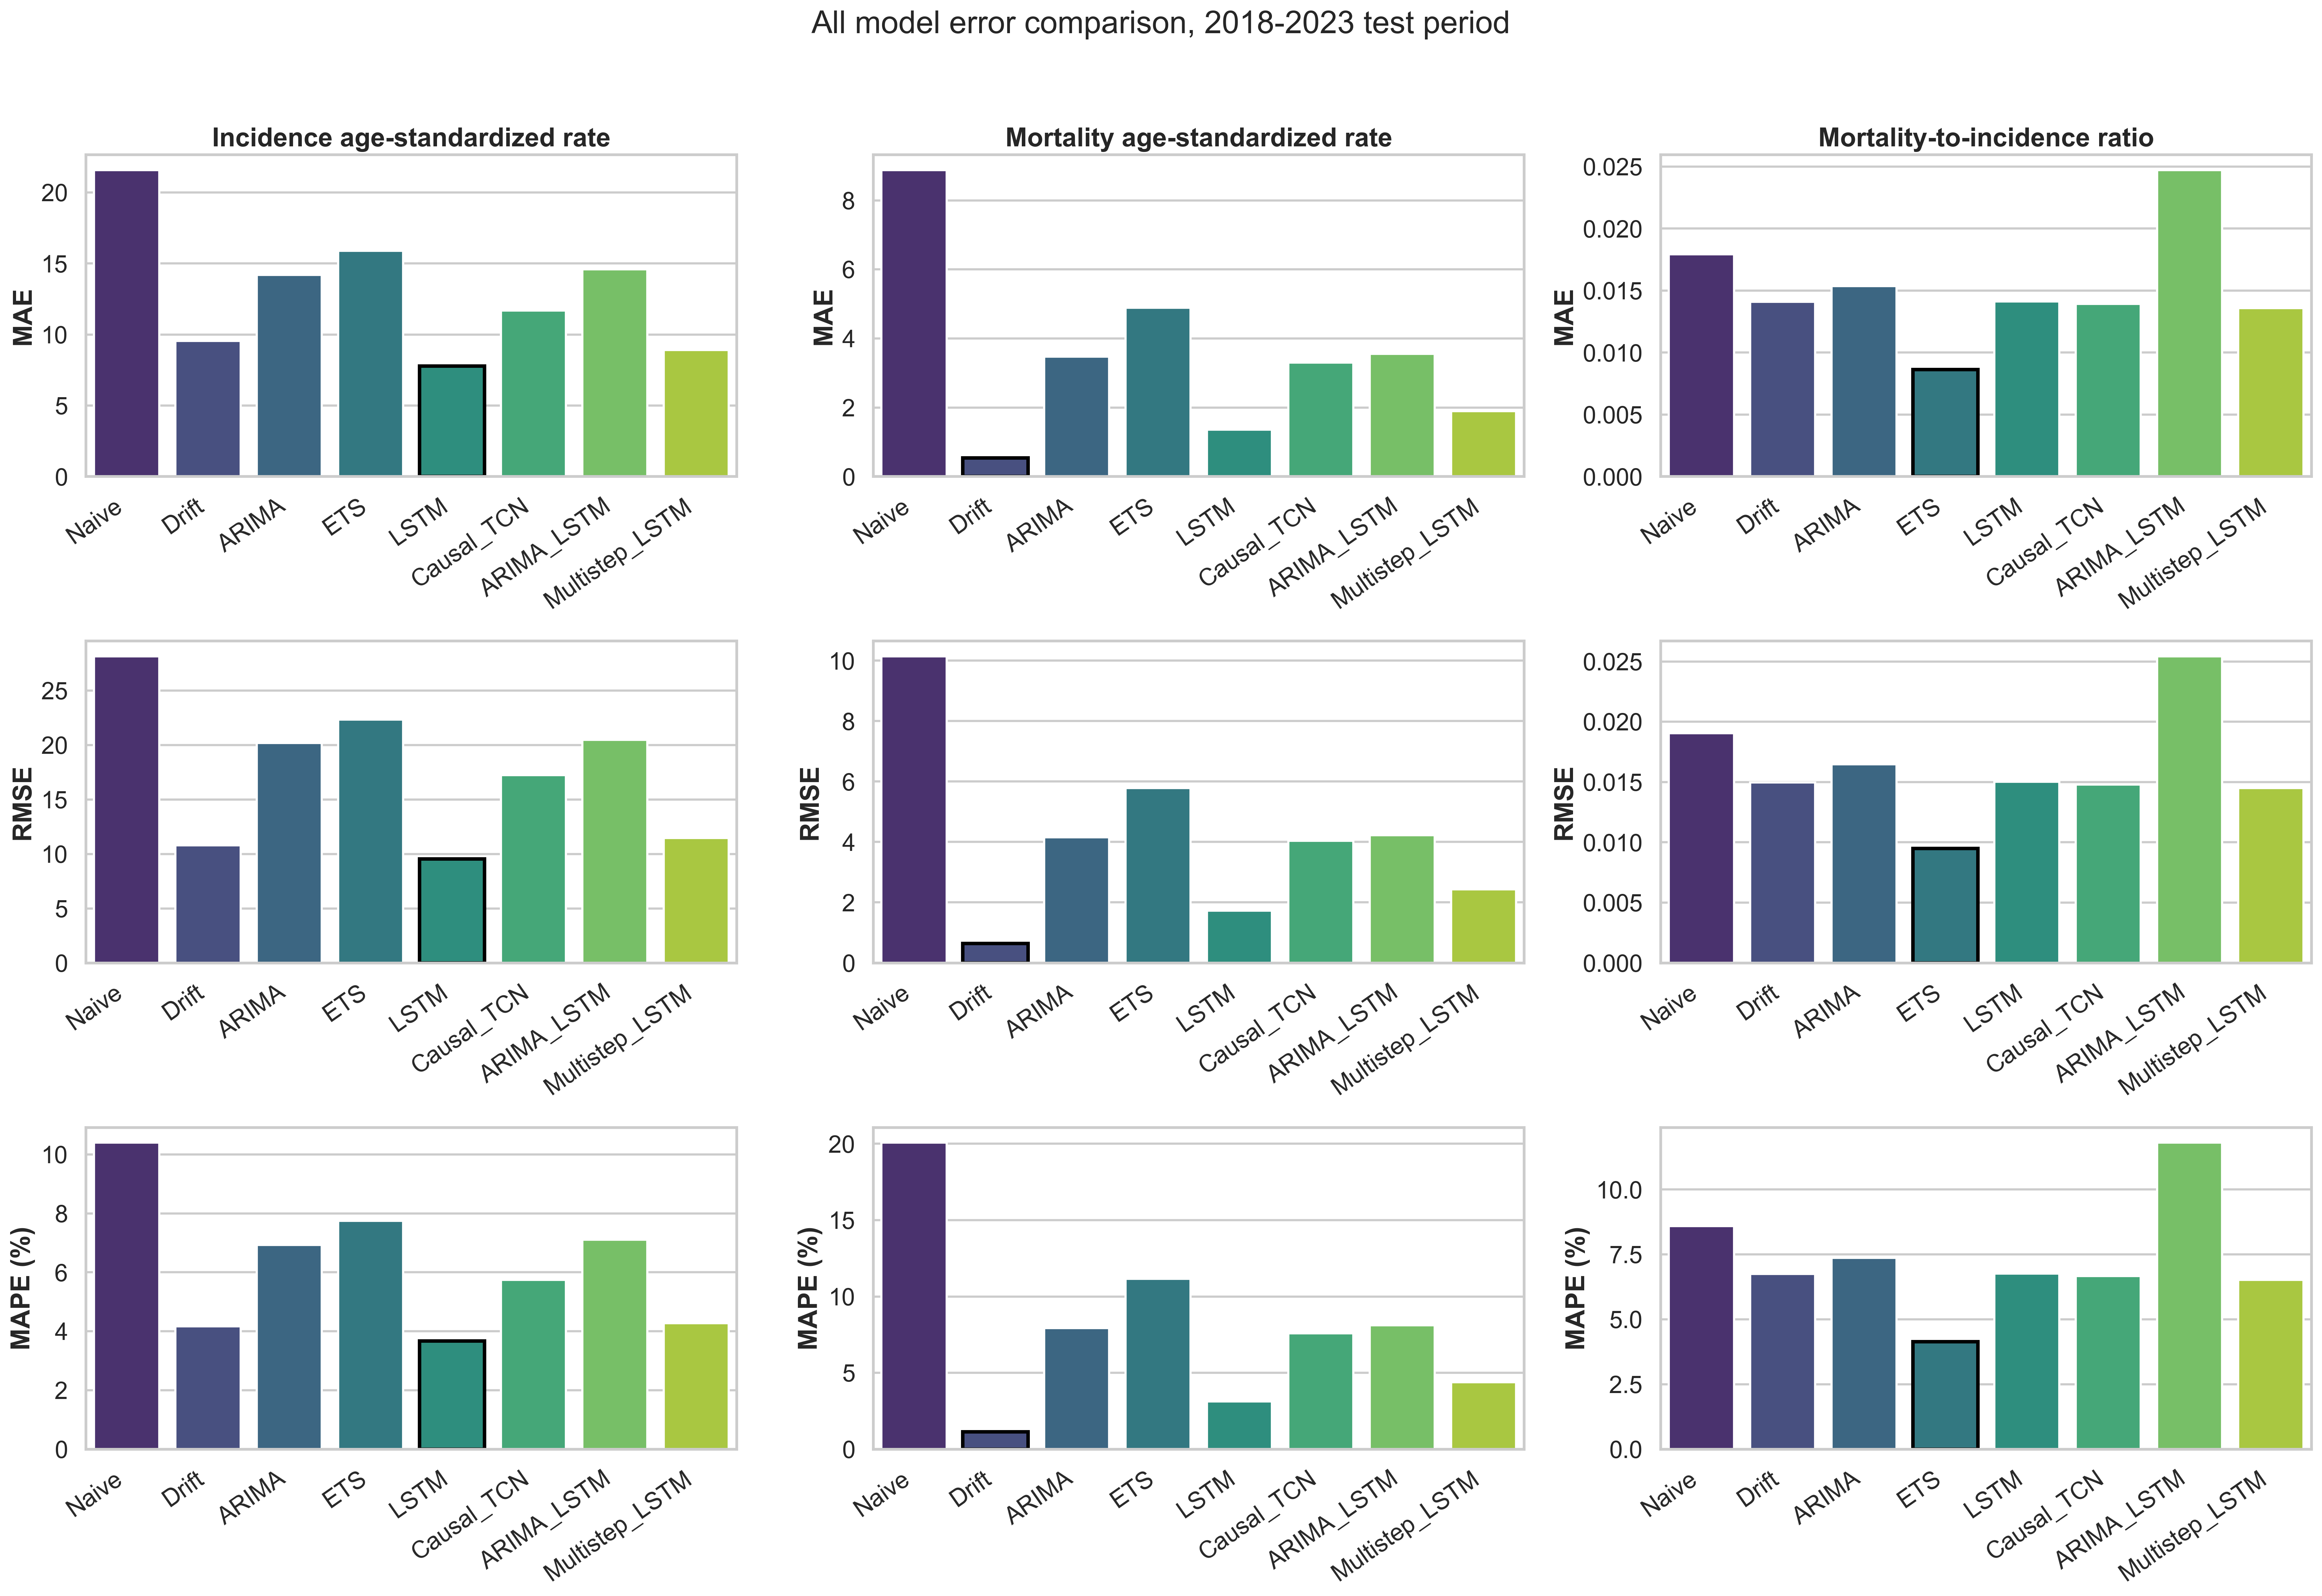
The best holdout model depended on the endpoint. An LSTM gave the lowest error for incidence, while a simple linear drift model performed best for mortality and ETS performed best for the mortality-to-incidence ratio. That result is a useful reminder that small annual datasets often favor simpler models.
| Endpoint | Selected model | RMSE | MAPE | 2030 point forecast |
|---|---|---|---|---|
| Incidence rate | LSTM | 9.544 | 3.67% | 146.51 |
| Mortality rate | Drift | 0.644 | 1.14% | 22.59 |
| Mortality-to-incidence ratio | ETS | 0.0095 | 4.14% | 0.216 |
04 / Model comparison
Evaluation before extrapolation.
05 / Interpretation
Forecasts are scenarios, not guarantees.
Thirty-four observations constrain every model.
GBD values are modeled estimates rather than direct surveillance counts, and structural changes in diagnosis, reporting, treatment, or policy could break historical patterns. Neural results are also sensitive to short-series training choices. The repository reports uncertainty and retains simple baselines so the additional complexity can be judged rather than assumed.