01 / The question
What is driving the growing diabetes burden?
Rates, counts, and disability tell different stories. This study separates them rather than treating “burden” as a single outcome.
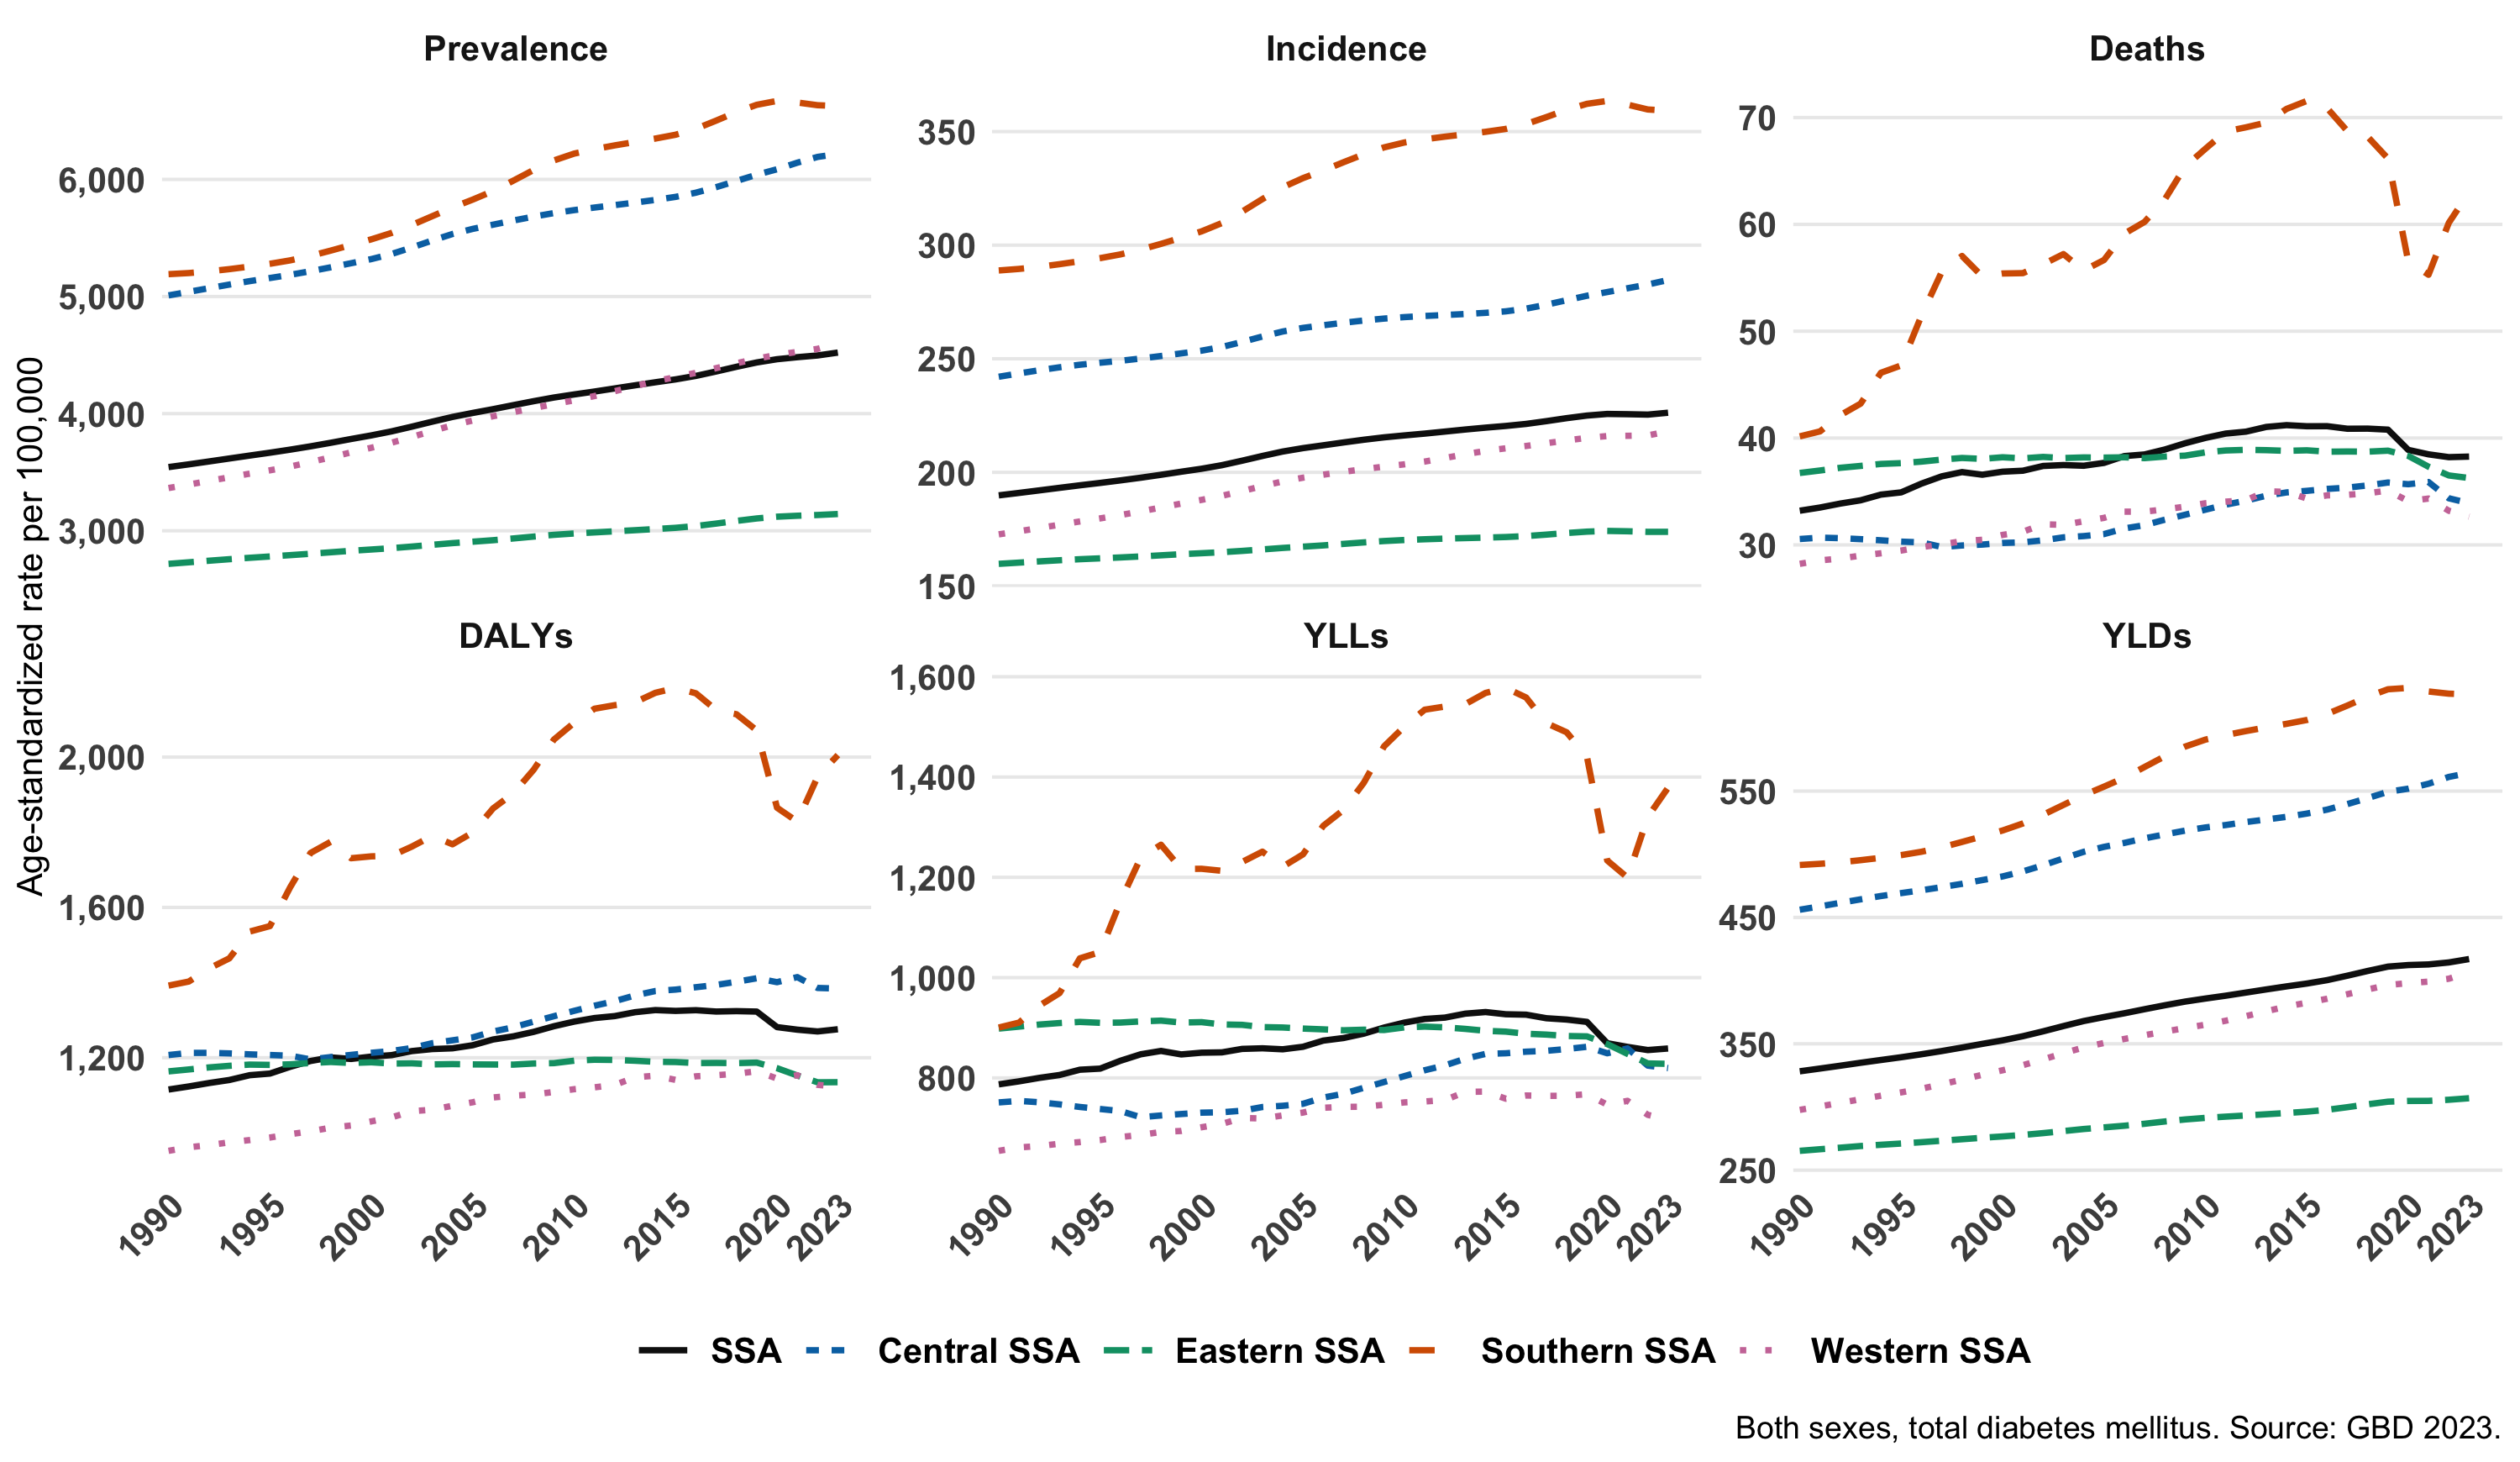
The analysis covers Sub-Saharan Africa overall and its Central, Eastern, Southern, and Western subregions. Results are stratified by sex and diabetes type across prevalence, incidence, deaths, DALYs, years of life lost, and years lived with disability.
Describe where rates changed, decompose why total counts changed, and compare forecast models before projecting to 2030.
02 / Methodology
Trends, decomposition, then forecasts.
Structure GBD extracts
Validate age-standardized rates, all-age counts, age-specific rates, and age-specific counts for 1990–2023.
Compare burden
Estimate rate changes, sex ratios, diabetes-type shares, YLL-to-YLD ratios, and subregional contrasts.
Decompose counts
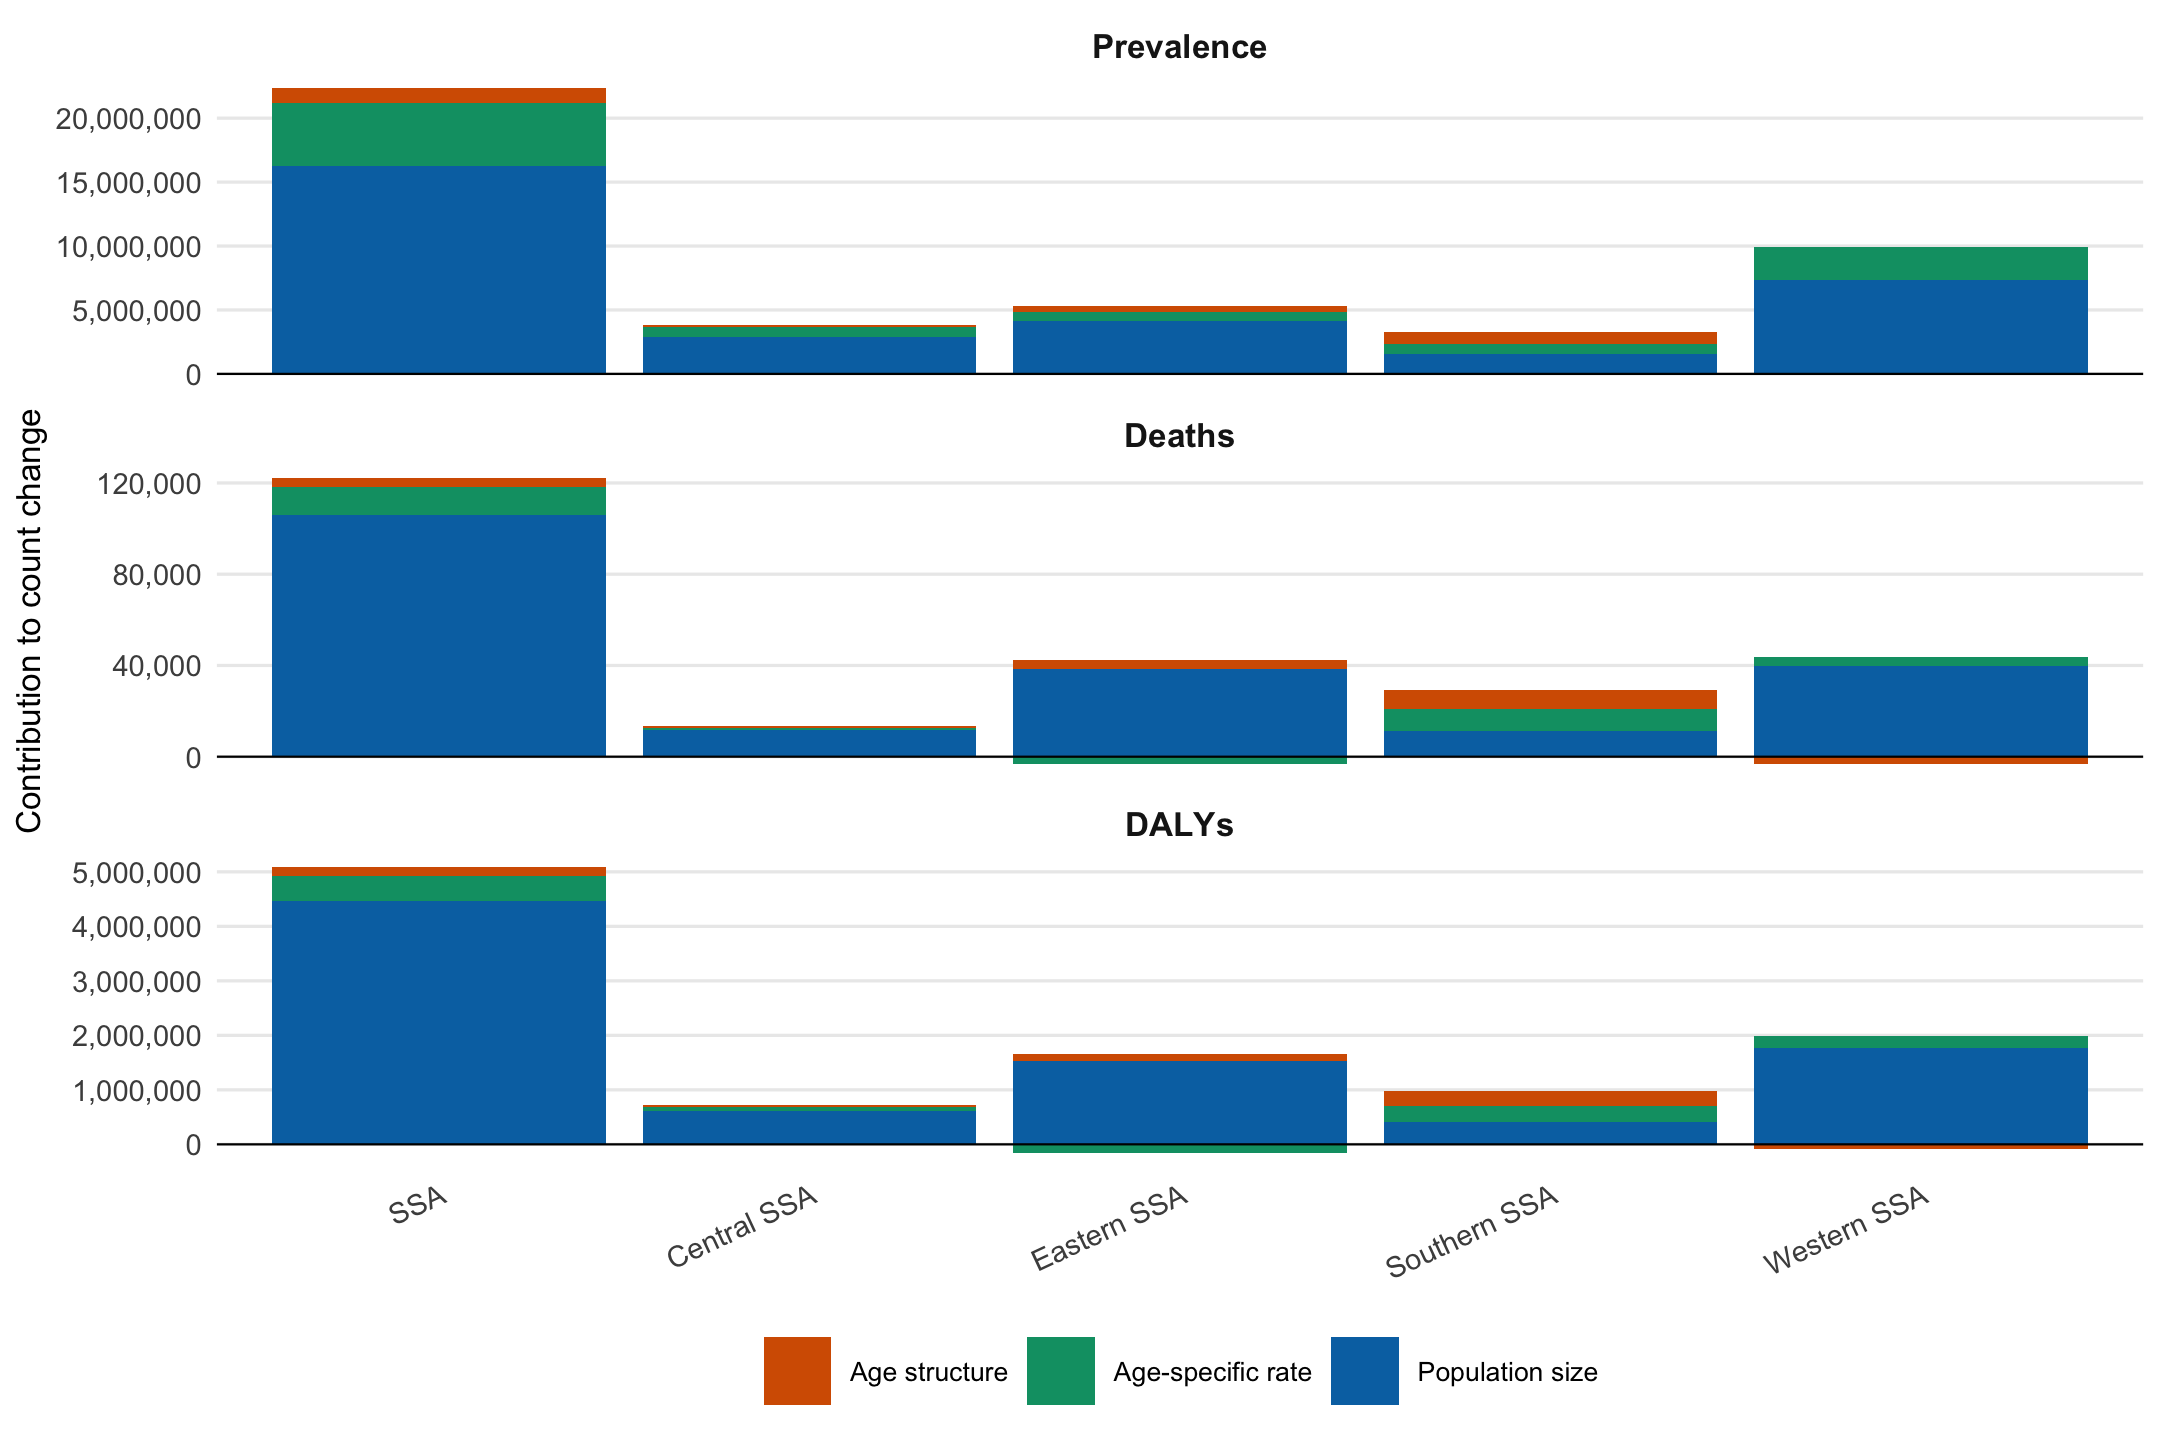
Use symmetric decomposition to separate population growth, population aging, and age-specific rate effects.
Validate forecasts
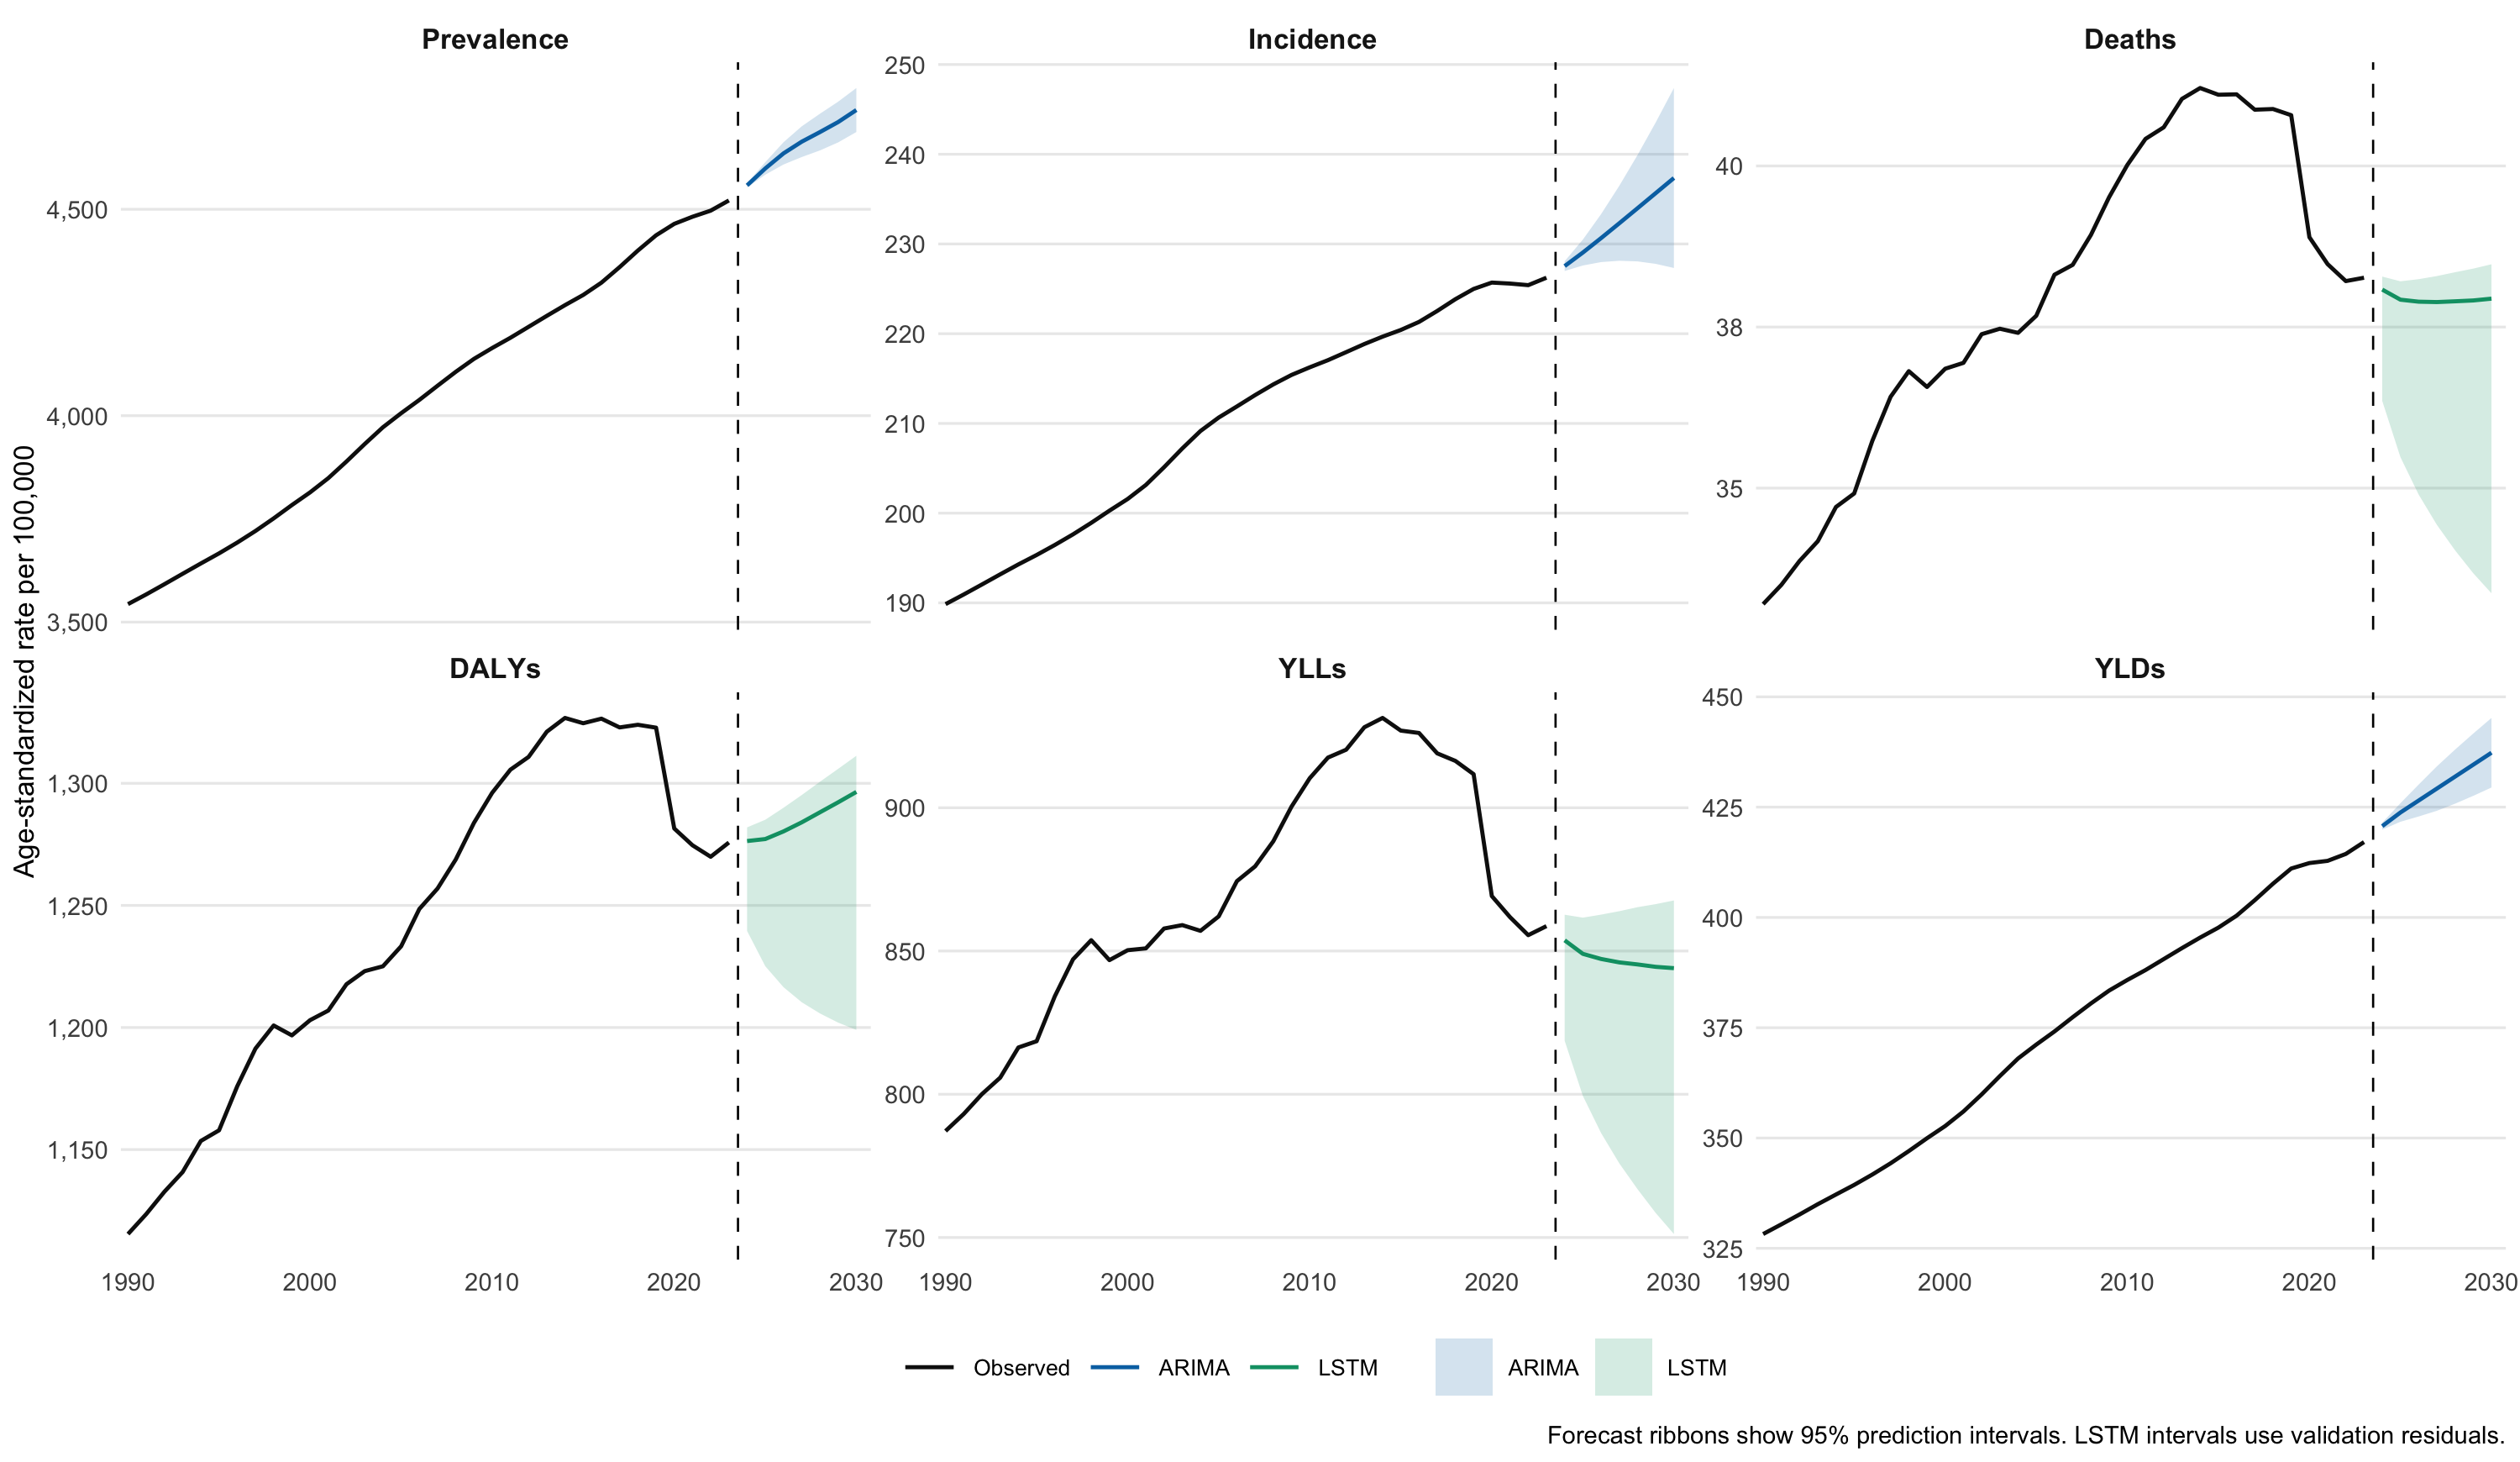
Compare ARIMA, ETS, and LSTM using rolling-origin or held-out historical predictions and scale-free error.
Project to 2030
Refit the selected model for each headline series and report prediction intervals.
03 / Findings
Prevalence rose while Type 1 mortality fell.
3,543.5 to 4,521.4 per 100,000
189.9 to 226.2 per 100,000
0.84 to 0.49 per 100,000
Total diabetes death and DALY rates increased by 15.3% and 14.4%, respectively, between 1990 and 2023. For absolute counts, population growth was the dominant driver: it explained 86.5% of the increase in deaths and 87.8% of the increase in DALYs across Sub-Saharan Africa.
| Measure | 1990 | 2023 | Change | Selected model | 2030 forecast (95% PI) |
|---|---|---|---|---|---|
| Prevalence | 3,543.5 | 4,521.4 | +27.6% | ARIMA | 4,740.5 (4,687.2–4,793.8) |
| Incidence | 189.9 | 226.2 | +19.2% | ARIMA | 237.4 (227.3–247.4) |
| Deaths | 33.2 | 38.3 | +15.3% | ETS | 36.2 (32.1–40.3) |
| DALYs | 1,115.4 | 1,275.8 | +14.4% | ETS | 1,245.3 (1,150.6–1,340.0) |
04 / Figures & forecasts
Population growth dominates the count increase.
05 / Interpretation
Modeled estimates require careful language.
Uncertainty intervals are not confidence intervals.
GBD inputs are modeled estimates with uncertainty from the source study. Forecast intervals represent model uncertainty and do not automatically propagate GBD uncertainty unless draws are included. The age-adjusted drift analysis is descriptive and should not be interpreted as a fully identified age-period-cohort model.